Nordstrom In-store Analytics
Figma Prototypes:
https://www.figma.com/proto/KY9Dbl6yv7HpkSvFki52Gb/Dizz_Store_Mangement_Tool?node-id=1-545&t=utz3gLrnLlh4FQ6a-1&scaling=min-zoom&page-id=0%3A1&starting-point-node-id=1%3A545
User Goals
Success Metric
Use Case 1
Use Case 2
Use Case 3
Use Case 4: Global Filter
Use case 5: Local Filter
Figma Prototypes:
https://www.figma.com/proto/KY9Dbl6yv7HpkSvFki52Gb/Dizz_Store_Mangement_Tool?node-id=1-545&t=utz3gLrnLlh4FQ6a-1&scaling=min-zoom&page-id=0%3A1&starting-point-node-id=1%3A545
Outcome
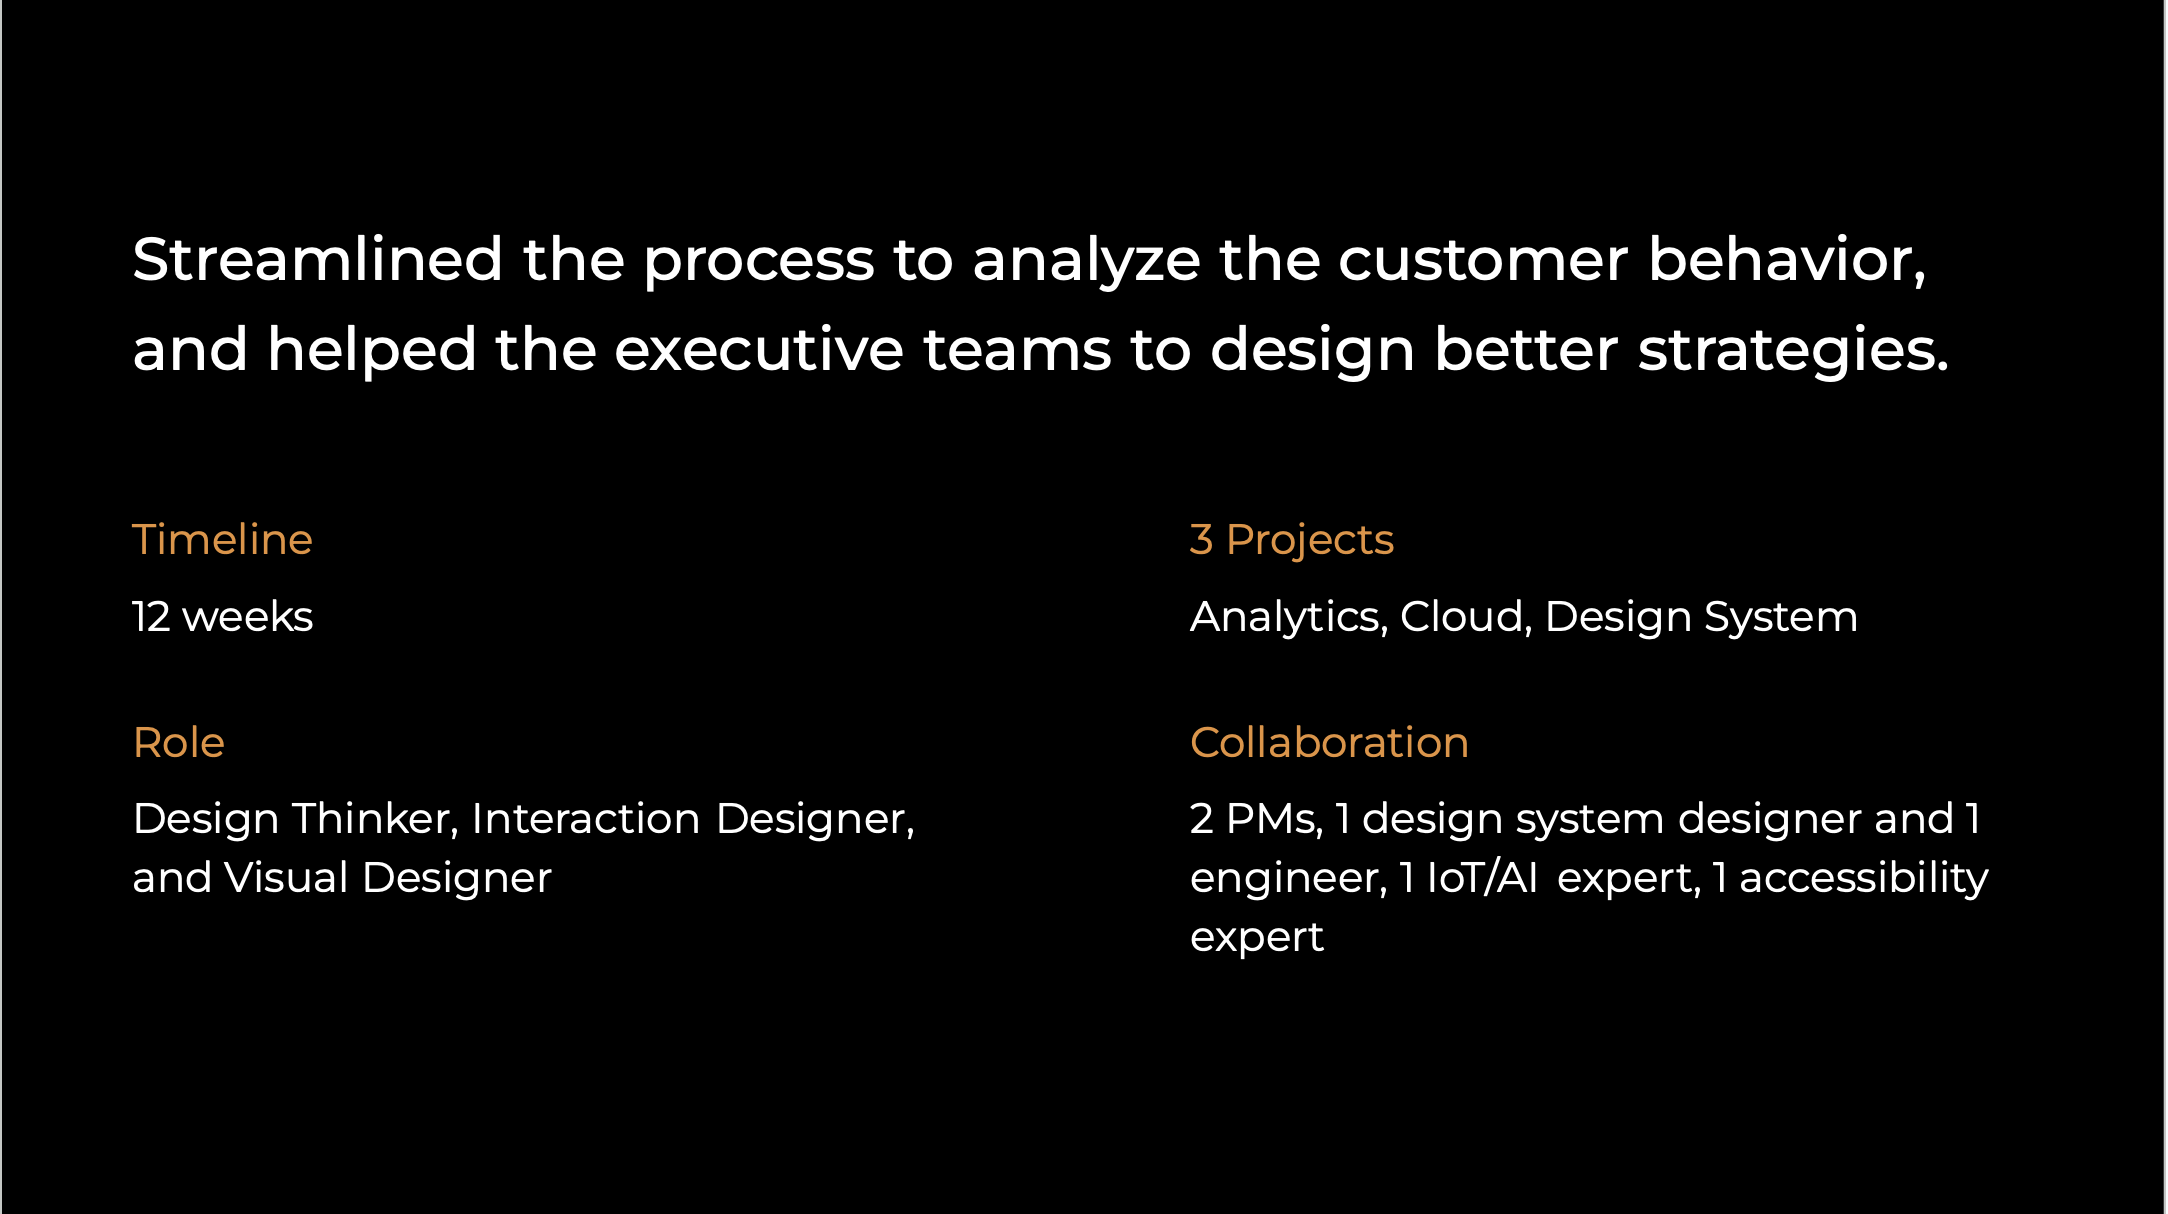
By the end of year 2022, with the help of this tool, business executives were able to track and analyze customer behavior and re-evaluate their strategy to attract users post-pandemic.
The success this product was that during weekends (Friday, Saturday, and Sunday), the stores were at 110% of capacity.


