
Product Designer - Data Security at Samsung Enterprise

Overview
Role
Product Thinker, Interaction Designer, Visual Designer
Team
Samsung Security
Collaboration
Designers, PMs, Writers, Engineers
During my stint at Samsung, I worked on Samsung Security team that was responsible data security for the enterprises. I streamlined data security configuration process for the Enterprise clients with the help of Cloud Automation.

Project 1: Automated Configuration

Project 2: Atomic Design System
Current Scenario & Problem
TL; DR: Enterprises are spending a lot resources into doing time-consuming & repetitive work.As you can see here in the illustrated scenario that enterprises like Walmart would buy the business phones for their employees. Before these phones go into the hands of the employees, the IT Administrators will configure phones for the data security. These configuration process is time-consuming as well as repetitive.

More often than not, business phones include crucial data regarding companies, intellectual property, and trade. Then the concerns over data-security would rise. Security engineers and IT Admins would configure these devices to restrict users from performing particular actions.
For example, restricting employees from taking screenshots or using Bluetooth to send/receive the files.
Research & Users
One of the key aspects that separates Enterprise product from B2C product is that the customers and users are different entity. Company management buys the software for their employees to use and their employees are the users.
1. Clients - Enterprises like Walmart, Target, etc.
2. Consumers - IT Administrators
DISCLAIMER: I’ll use “User” as a generic term to refer Customers and Users in this case study.

Constraints:
I didn’t have direct access to the clients. But product managers worked as a bridge between clients and I. Also, I relied to self-research by studying technical documentations and past usability studies.
User Goals
Client Goals:
1. High KPI and ROI.
2. Value Automation.
3. Fast and Straightforward Process.
Consumer Goals:
1. Scannable User Interfaces.
2. Scaled dataset should not change the UI. (Scalability)
3. Salient Information in Display.
4. Error-Tolerant Software.
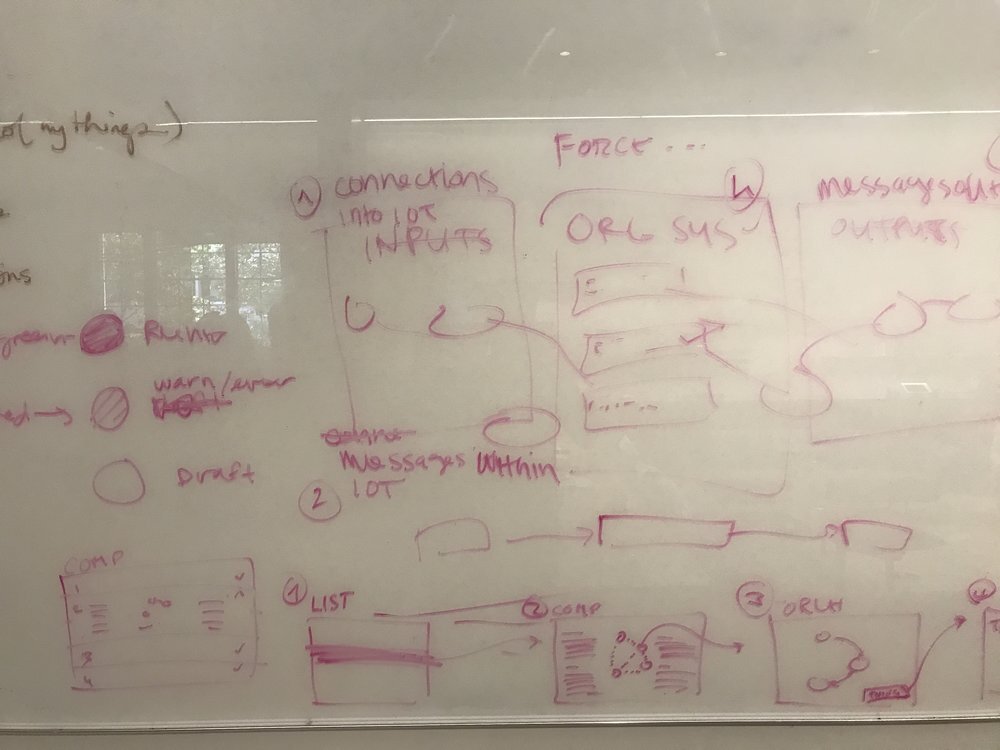
Technology Exploration
After learning about the Customer Goals, I decided to explore the Cloud Technology and see if I could design a solution that falls into that trajectory. Clients could take the advantage of Cloud Technology in two ways:
1. On-demand Data Storage.
2. On-demand Processing Power.

Framework
To define and design the solutions I came up with a modified Stanford d.school framework. It has always helped me to jumpstart into any problem and eventually reach a right solution.

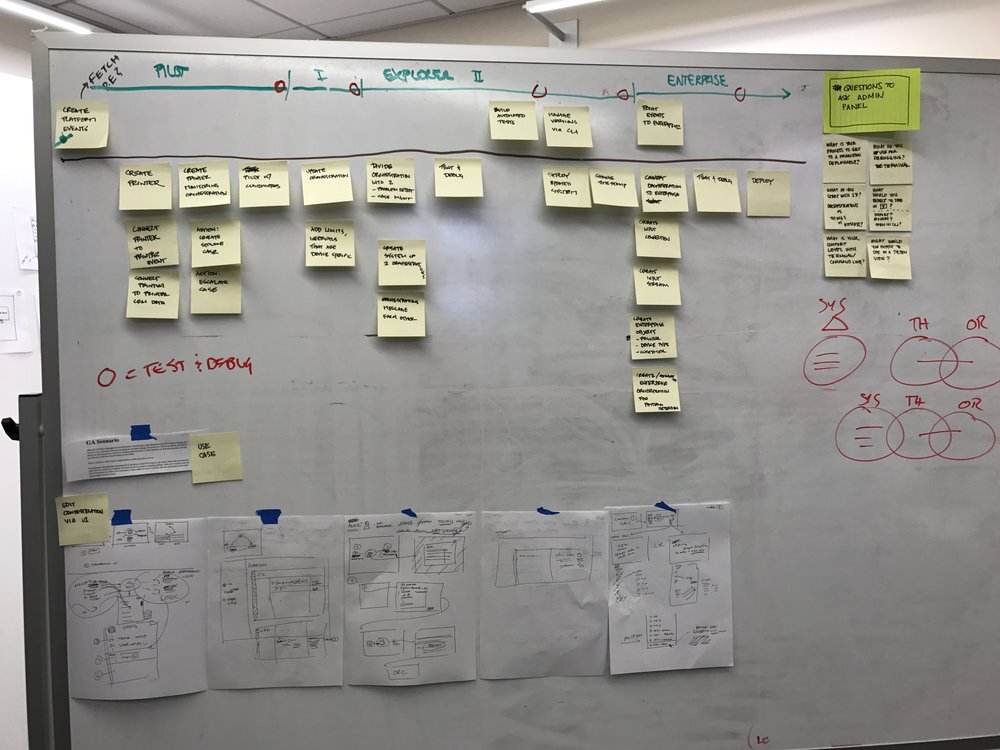
Content Structure & Fail-fast Sketches

Fulfilling Client’s (Enterprises) Need:
In order to fulfill the client need, I defined the information architecture as simple and straightforward as possible. Complex problems don’t always have to be complex solutions. Let’s keep it simple and straight.
Blueprint of the Solution (Automated Configuration)
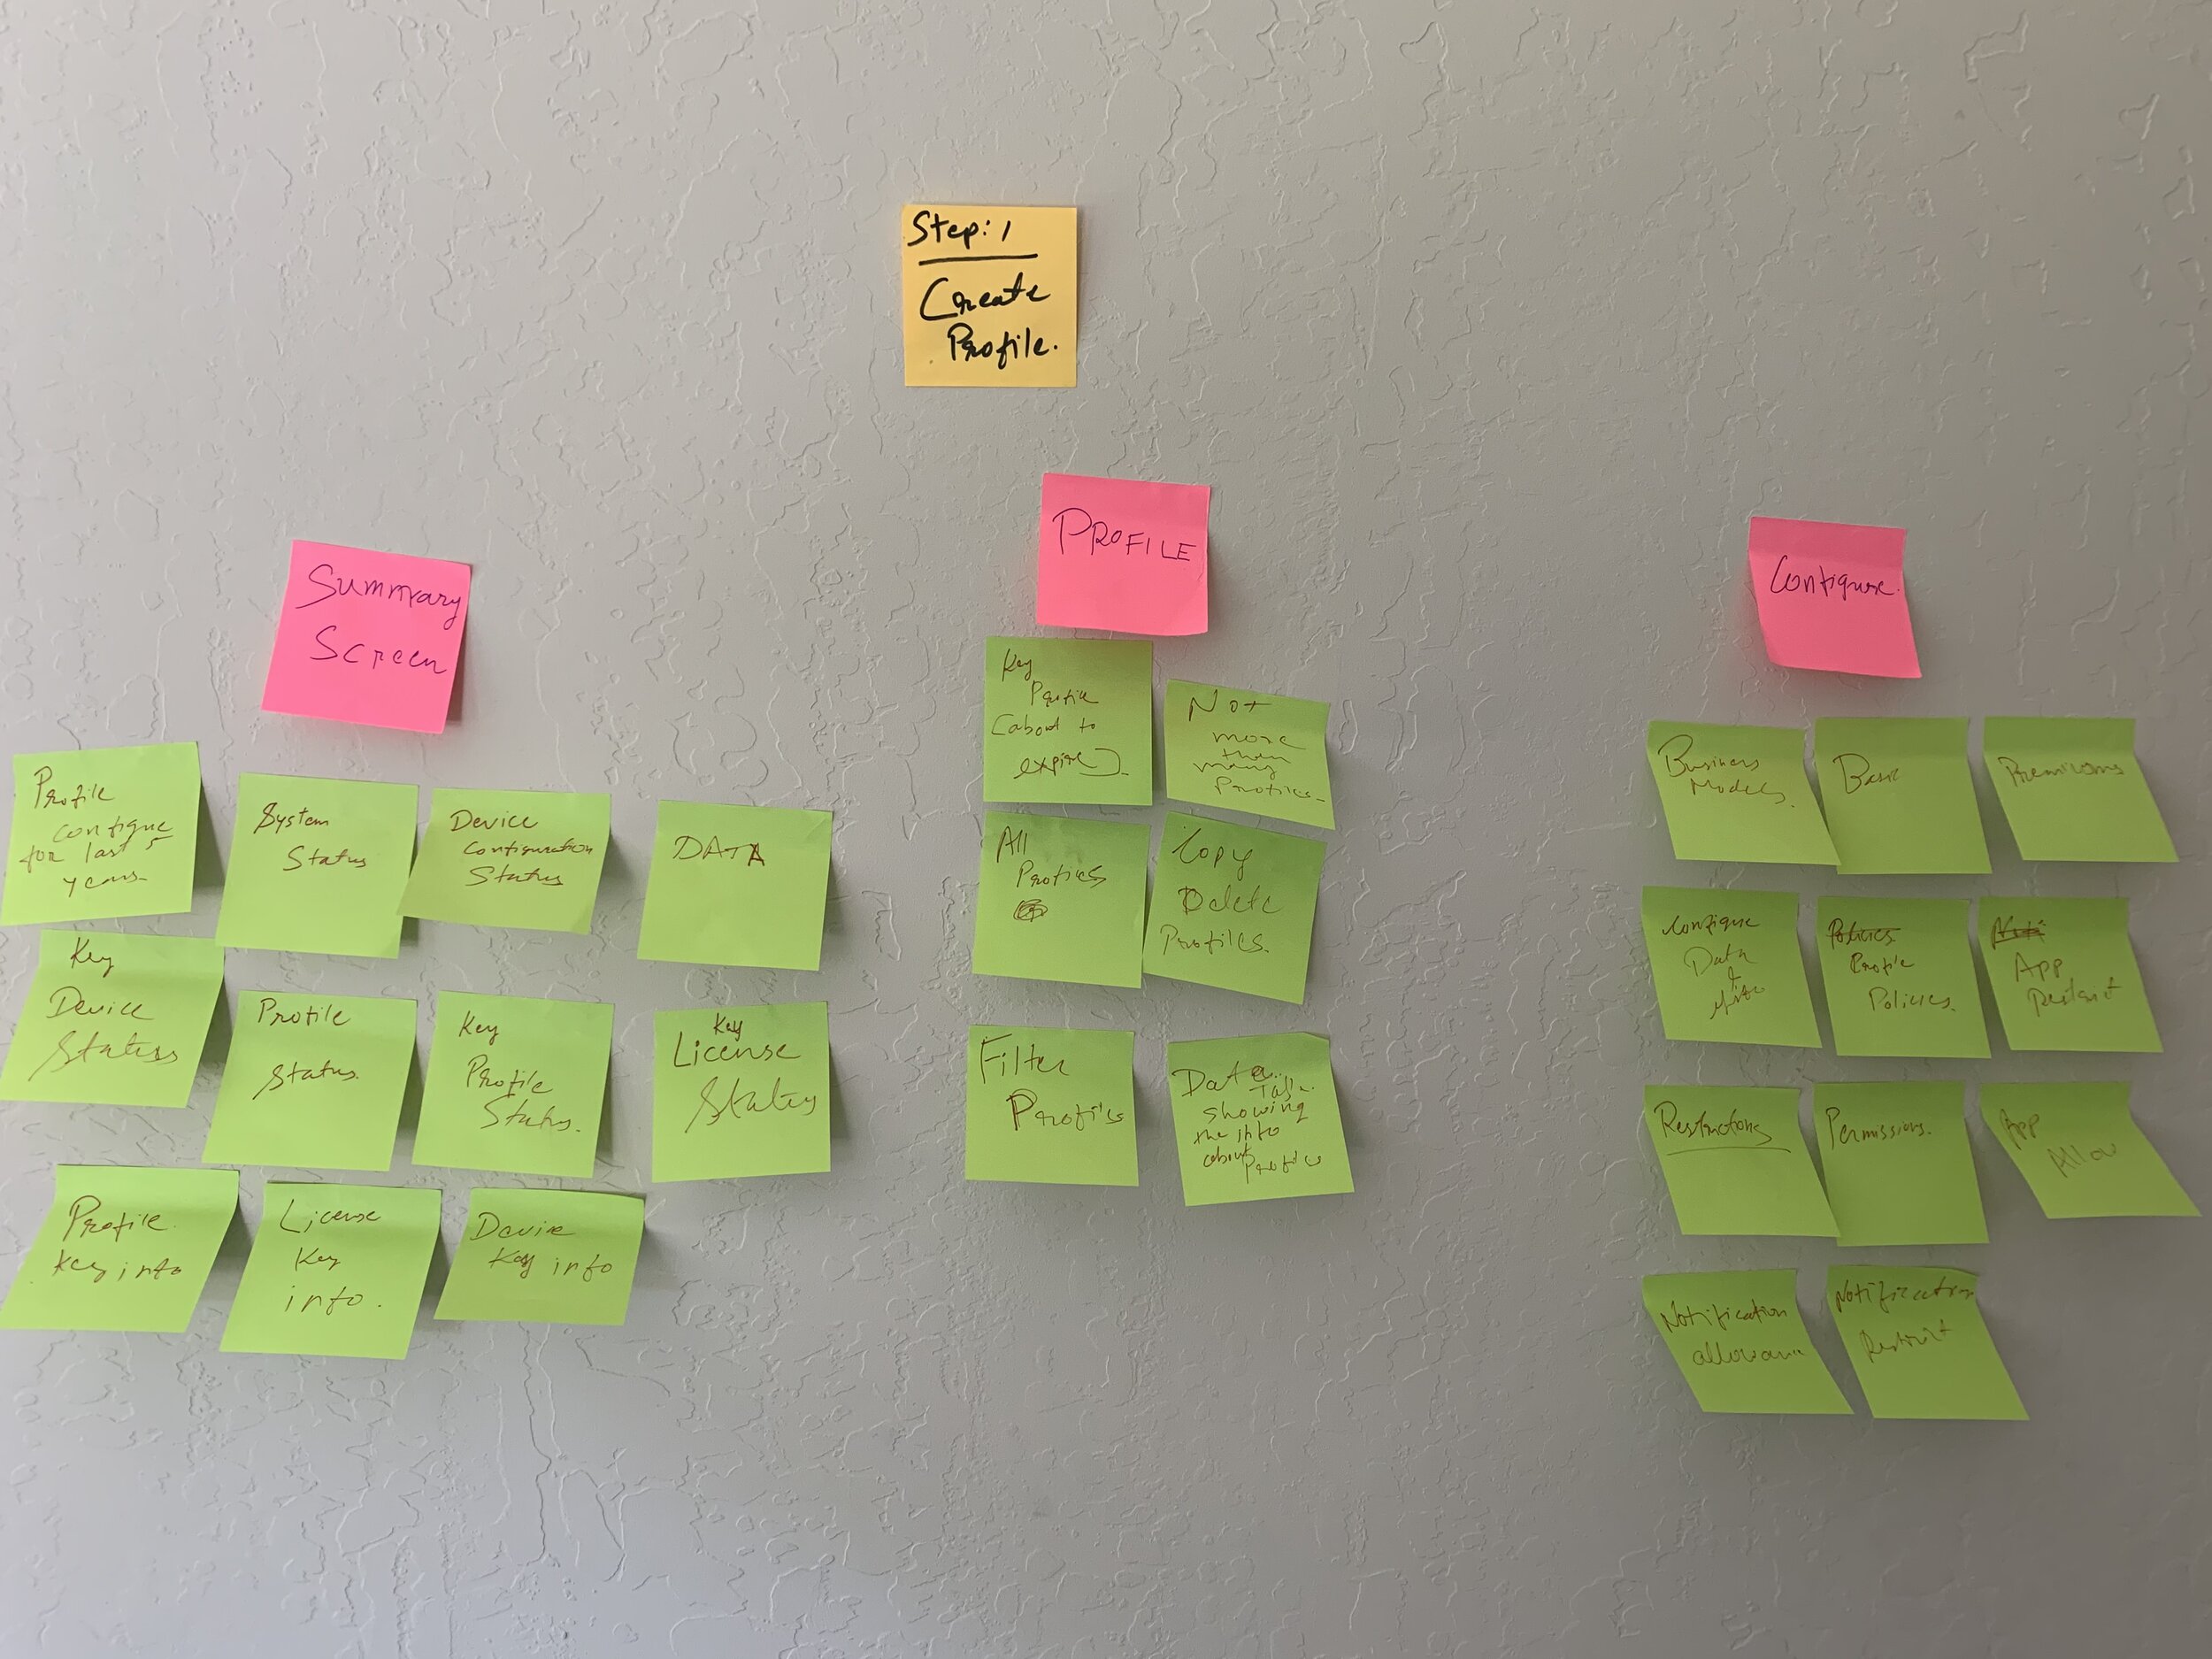
Step 1: Create the Profiles : First, IT Admins will create the Profiles for the different employee groups. And, these profiles are stored on the cloud for on-demand use.

Step 2: Assign the Profiles : After Creating the Profiles for different group of employees, IT Admins will now assign those profiles to any number of mobile devices. And, security configuration will automatically be taken care by the Cloud Processing Power.

Success Metric
After discussing with the Product Manager I learned that the success of the product would depend on the following criteria:
1) 65% of the existing clients should migrate to the new product (automated configuration) that I am going to design. It would cover the cost of the production in first 2 months.
2) If 50% of the existing clients migrate then we could at least start gathering enough amount of qualitative feedback so that we can reiterate and remine product workflows and features.
Final Product

Design Process & Meeting Consumer Goals
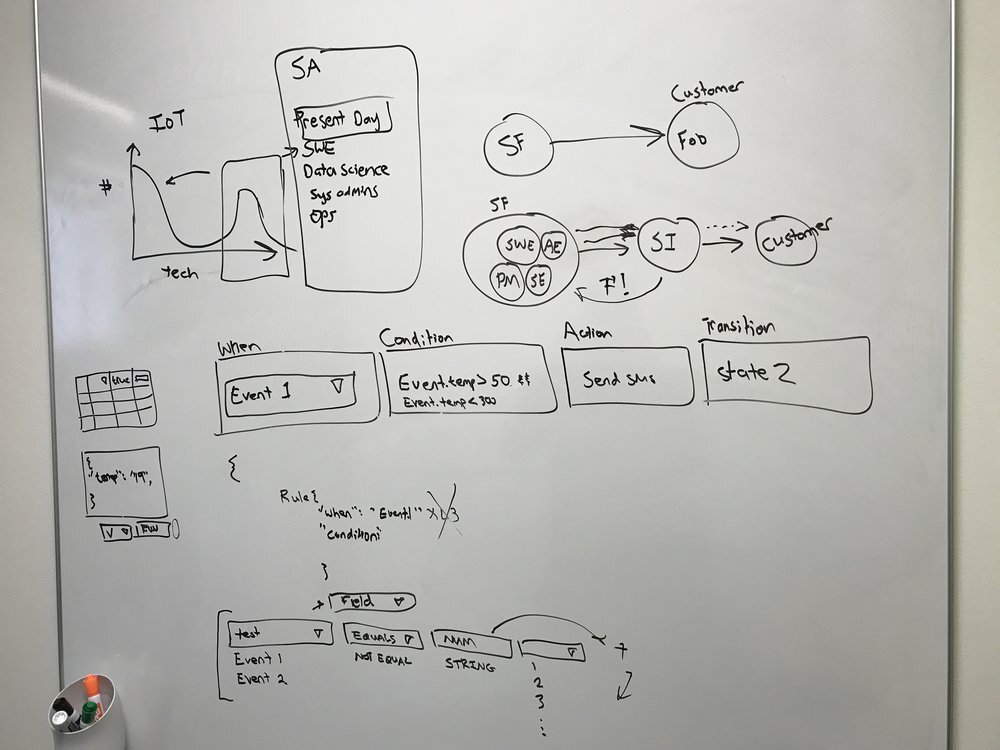
Feature 1: Configuration Timeline
What does this feature do? Clients will visit this part of the dashboard to learn about the trend of profiles either succeeded or failed to configure in a particular timeline.
What consumer (IT Admins) need does it solve? -Error Tolerance Software & Scannability. Well, it is a simple data viz that shows the trend, but while filtering the data clients can inadvertently commit an error, so here I have taken approach of preventing errors from manifesting on the screen.

Scenario number 1: Error / Unpleasant experience:
Here you can see that if the user choses to look at the data for a year of period by each day then the users could feel frustration and they can’t scan the data efficiently.

Scenario number 2: Error Recovery:
One solution to this problem is that the system can throw a warning to the users that the display method is unrealistic for the timeline.

Scenario number 2: Error Prevention:
The most optimal solution is to make the UI more Error Tolerant and take care for the users and not to “penalize” for their inadvertent mistakes. Hence, if the timeline is too large, I prevented them from choosing “Daily View” or “Weekly View”.

Feature 2: Dashboard Cards
What? It helps users to scan the current state of the configured, failed, and pending devices
Why? It is valuable for the users because it increases their scannability and gives them actionable insights. Also, this feature is highly scalable.

Iterations:

Scalability Level 1:

Scalability Level 2:

Scalability Level 3:

Scalability Level 4:


Feature 3: Pinning Important Profiles.
What? Users will find this feature important for them to pin important Profiles on their dashboards and see their progress whenever needed.
Why? With this feature, I solved scalability problem. First you’d see the button to pin the Profiles and then you’ll see the pinned profiles below it. It was necessary because the number of pinned profiles could expand to 8 rows (2 per row). So, regardless of the number of pinned Profiles, it is efficient for the users to pin a new Profile quickly since it always stays on the top.

Iterations:
When the button to pin the profile stays on the bottom of the cards, it could become an issue if the number of Profiles are growing. See the example below.


Let’s chat more about this project, email me at dishant.ux@gmail.com
Results & Reflection
I helped my team achieve the success defined by my product manager and I. Instead of 10 days, we were able to make 65% of the existing clients adopt this new feature in just 8 days.
The whole project vague in the first half of the duration. But it gave me an ability to look into:
1. Sometimes, there is no process and that’s fine. That’s how real world projects operate. Yet get launched and earn revenue.
2. Have a vision of what you want even though you don’t see any means to reach there (as of now!)
3. Iterate early and often. Don’t settle on the solutions. Solutions, in the real world, are yet another version. They are meant to be modified, changed, scrapped.